

Slight Reliability EP 113: AI Use-cases for SRE with Shmuel Kliger
January 12, 2026 • Shmuel Kliger
Originally published to the Slight Reliability Podcast.
Read what people are saying about Causely
January 12, 2026 • Shmuel Kliger
Originally published to the Slight Reliability Podcast.

December 3, 2025 • Severin Neumann
Originally published as a livestream to e-After Work.

December 1, 2025 • Causely
Originally posted to Intellyx by Jason English.

November 26, 2025 • Severin Neumann
Originally posted as a livestream from OllyGarden.

November 25, 2025 • Causely
Originally posted to TFIR by Monika Chauhan. Causely’s Severin Neumann explains how causal reasoning, MCP, and AI-driven automation are transforming SRE workflows and Kubernetes reliability.
The name of the company is Causely. We never call it "Causely dot ai" or spell it as "Causely.ai".
Hex Code: #474199
Hex Code: #27b181
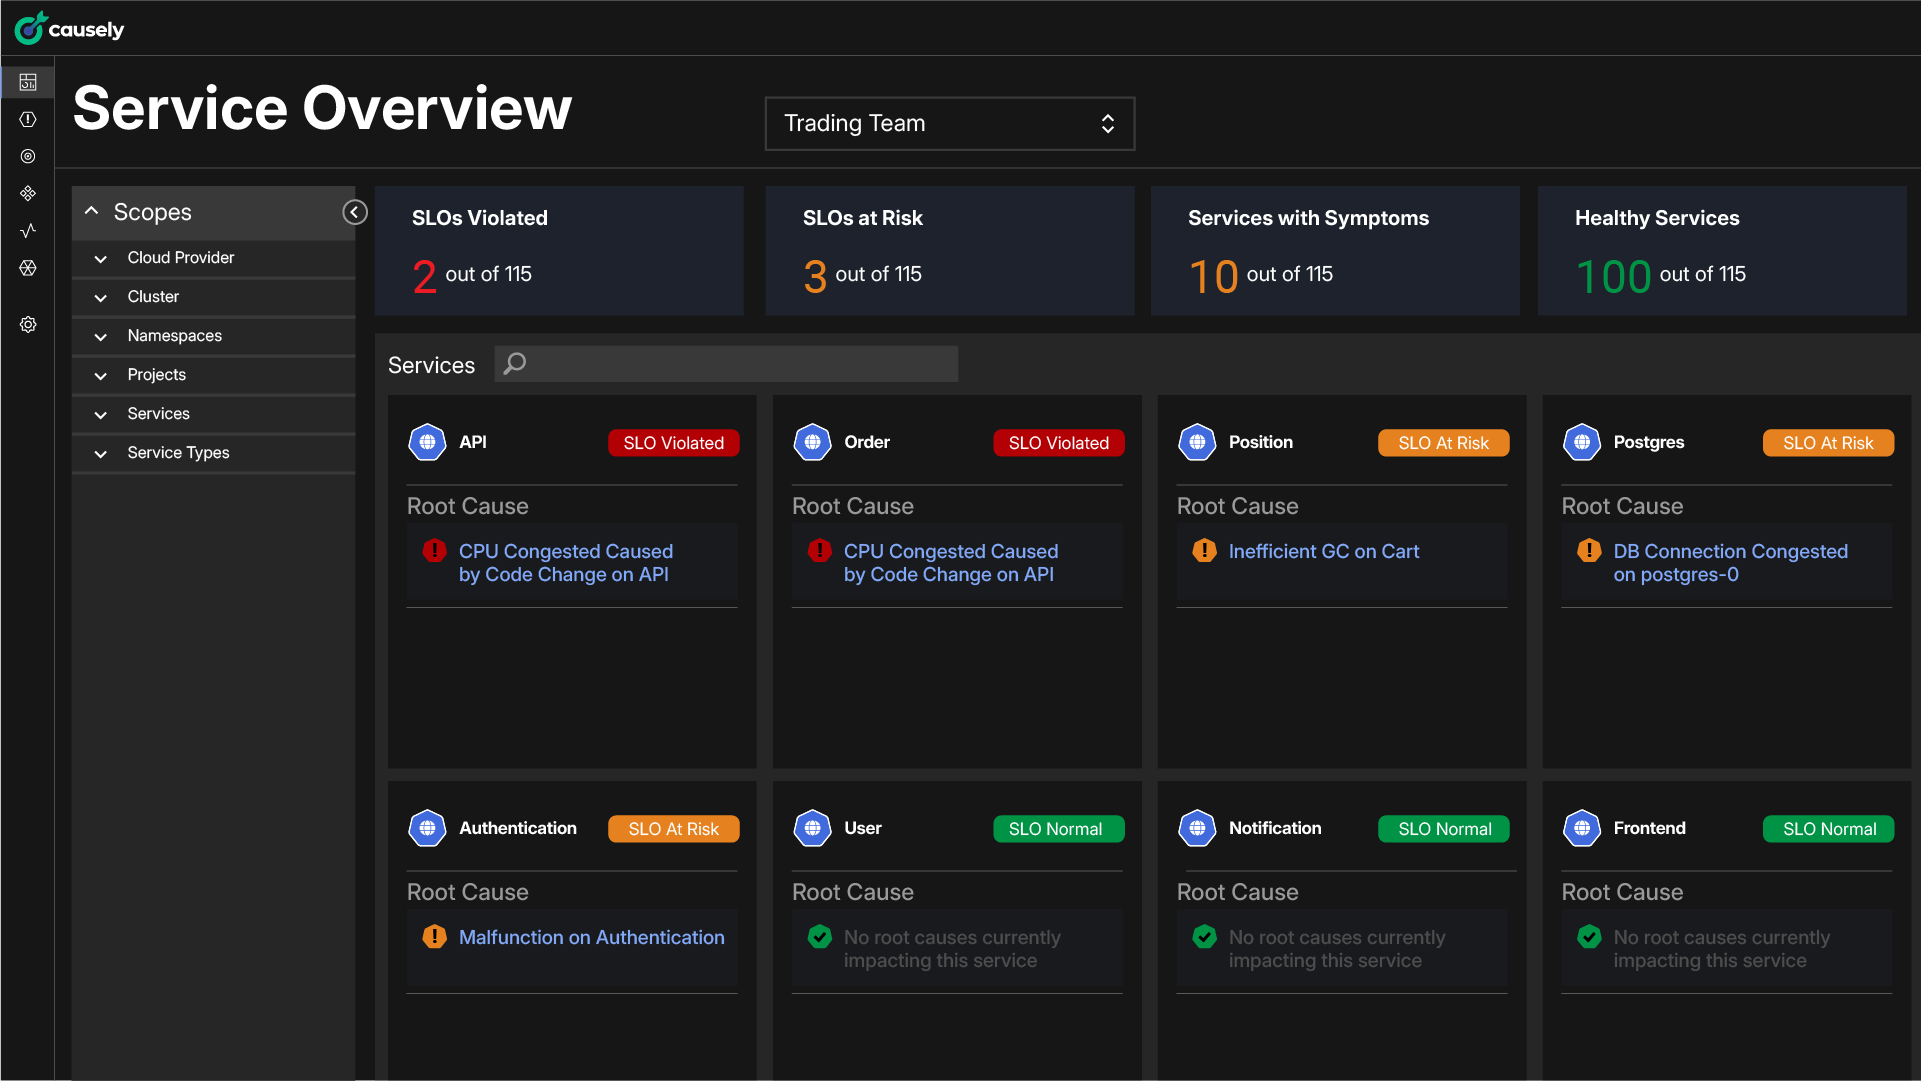
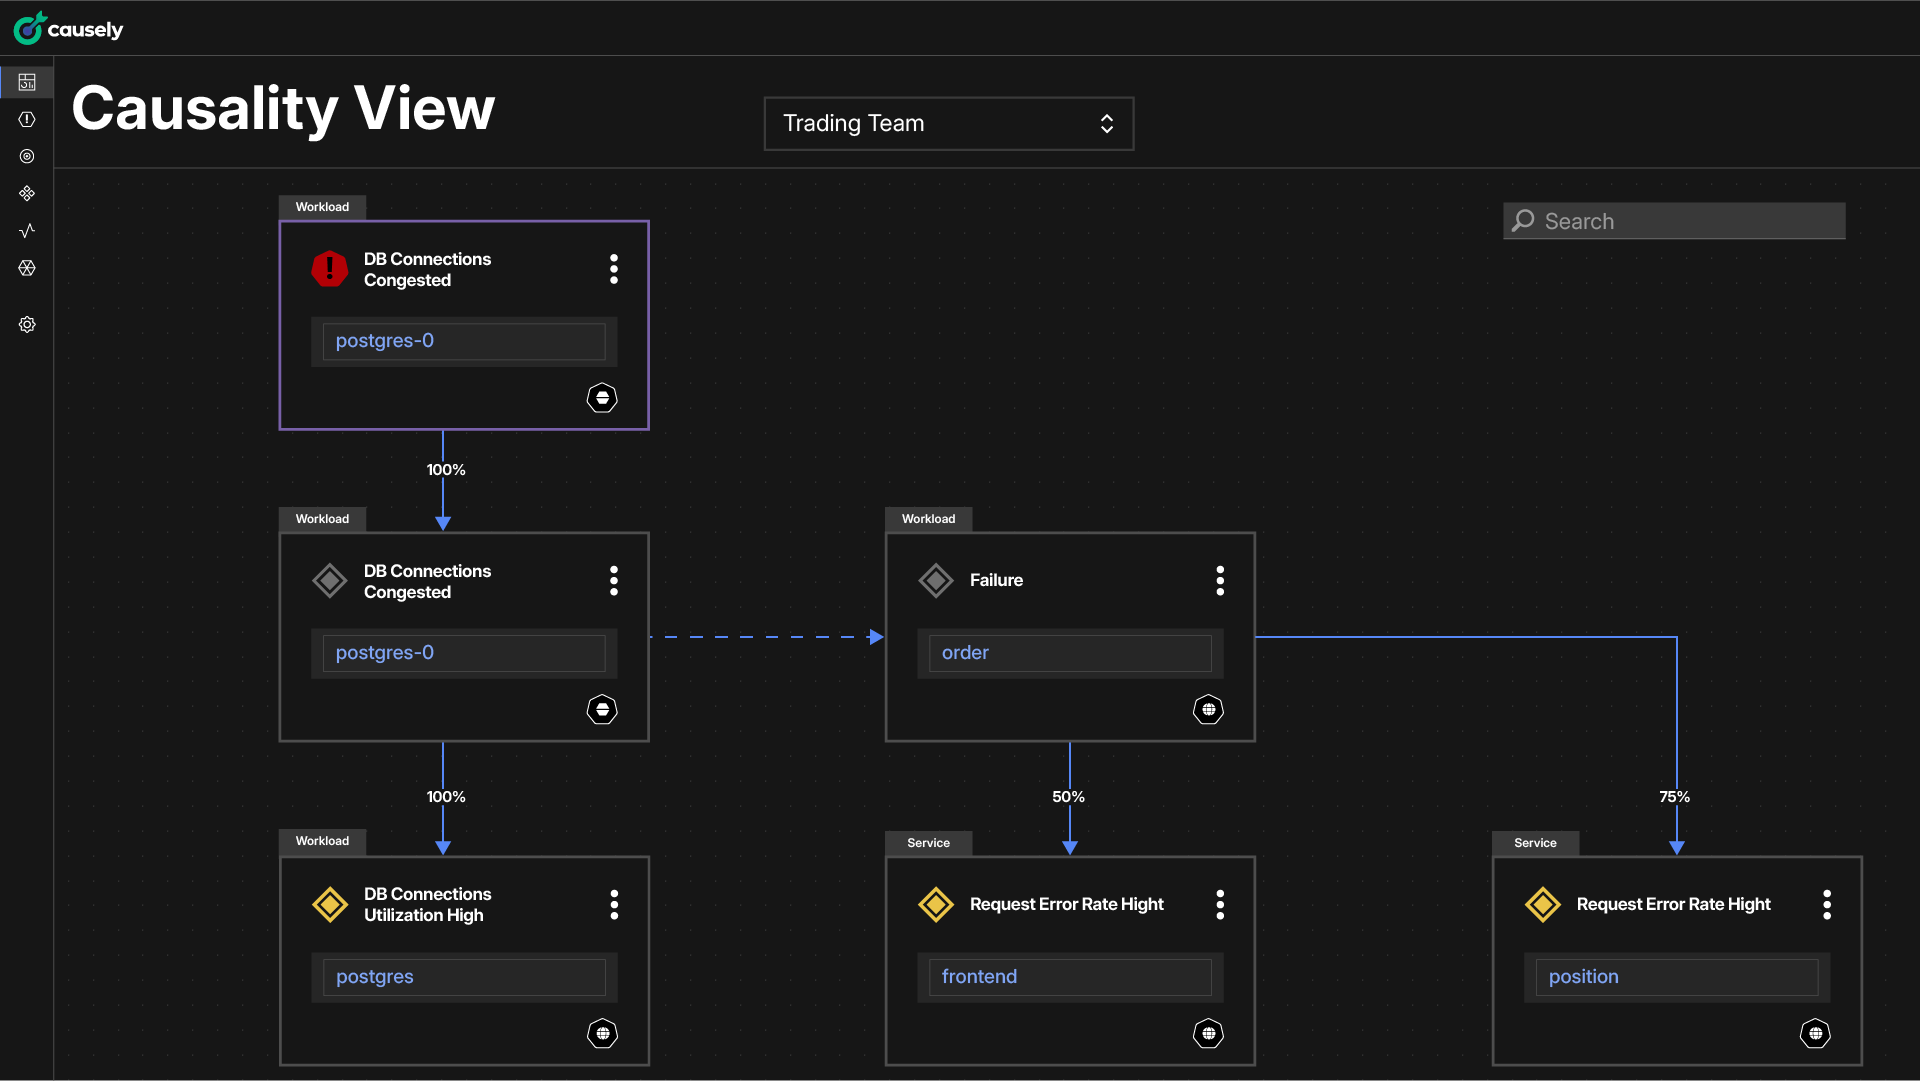
Use these simplified screenshots to explain Causely. They contain no sensitive information.

Causely is the missing layer between your observability data and autonomous operations.


