OpenTelemetry Logging Best Practices to Avoid Drowning in Data
Ben Yemini
August 28, 2025

The OpenTelemetry (OTel) community has made enormous progress in how we think about logs. Not long ago, application logging was a patchwork of vendor- or language-specific formats and ad hoc fields, without a consistent way to connect logs with other telemetry. Now, thanks to OTel’s logging specification and Collector pipeline, teams can capture, enrich, and correlate logs across any service and runtime in a standardized way.
In this post, we’ll recap OTel logging best practices, explore how to use logs effectively in troubleshooting without drowning in data, walk through a tutorial workflow you can apply today, and show how Causely operationalizes this approach automatically at scale.
OTel’s Established Best Practices for Logging
The OTel project has laid a strong foundation for logs to work alongside metrics and traces:
- Consistent Structure – OTel’s log data model ensures every log record has a predictable shape, making it machine-parseable and easier to route or query.
- Context propagation – By embedding trace IDs, span IDs, and resource attributes in every log entry, OTel makes it possible to pivot seamlessly between logs, traces, and metrics in your analysis tools, without guesswork.
- Unified Collection – The OTel Collector can ingest logs from multiple sources — applications, infrastructure, third-party services — and normalize them before routing to storage or analysis tools.
- Enrichment and Filtering – Processors in the Collector allow you to enrich logs with metadata (region, environment, service version) and filter out noise or limit verbosity.
If your team is following these practices, congratulations: yYou already have the building blocks for the next step.
Why Logs Need Context to Be Useful
Logs are essential to troubleshooting — they carry the fine-grained evidence of what went wrong. But in large, OTel-instrumented systems, collecting every log line from every service creates new challenges:
• Mountains of data – terabytes of logs that make queries slow and expensive.
• Information overload – too many log lines without guidance on which ones matter.
• Slow incident response – engineers spend precious time searching instead of fixing.
The goal isn’t to reduce the importance of logs — it’s to use them in context. By correlating logs with metrics and traces, you can elevate logs from raw text into causal signals: proof tied directly to the root cause of a problem.
Instead of asking engineers to manually dig through a warehouse of logs, the right approach is to automatically pull the relevant 0.1% of logs that explain the incident. Logs don’t lose their role; they gain clarity by being connected to the surrounding signals.
Tutorial: Implementing Contextual Logs in OTel
Here’s a practical outline for how to set this up today using OTel:
Step 1 – Ensure Rich Context in Logs
Start with a simple log statement, for example:
log.warn("Database connection pool exhausted – queries may fail");
On its own, this message is useful but limited. In a large distributed system, you need more context to understand which service emitted it, in what environment, and how it relates to the rest of a trace.
That’s where OTel comes in. When the OTel SDK is properly configured, it automatically enriches log records with resource attributes (service name, version, environment, region, etc.) and correlation identifiers (trace_id, span_id).
For example, the same log record might look like this once enriched:
resource:
  attributes:
    service.name: "checkout-service"
    service.version: "1.2.3"
    deployment.environment: "production"
    cloud.region: "us-east-1"
trace_id: "91be8f92d45e471ea0bf1c25be8e3f1c"
span_id: "2d4b1c73c9c3e7f0"
severity_text: "WARN"
body: "Database connection pool exhausted – queries may fail"
This enrichment happens automatically if you’ve instrumented with OTel, which means developers don’t have to manually add metadata. They just log as usual, and OTel ensures those logs are correlatable with traces and metrics.
Step 2 – Collect and Route Logs Through the OTel Collector
service:
  pipelines:
    logs:
      receivers: [otlp, filelog]
      processors: [attributes, filter]
      exporters: [otlphttp]
Step 3 – Use Metrics/Traces to Narrow the Scope
In your analysis tool, start with:
- Error rate, latency, or saturation metrics to find affected services.
- Trace waterfalls to spot where requests slow down or fail.
Step 4 – Pull Only Relevant Logs
service.name = "checkout-service"
AND timestamp >= "2025-02-10T14:03:00Z"
AND timestamp <= "2025-02-10T14:08:00Z"
If using the OTel Collector with filtering, you can even forward only scoped logs to your log store during incidents.
Step 5 – Confirm and Remediate
Use the filtered logs to confirm the root cause hypothesis, capture the evidence you need for a fix, and move directly to remediation.
How Causely Operationalizes This Workflow
The tutorial above shows one way to approximate a more efficient log workflow by narrowing scope before querying logs. Causely builds on this approach by treating logs as integral to causal analysis — automatically surfacing the ones tied to the root cause.
Here’s how we do it automatically:
- Top-down causal reasoning – Causely continuously builds a model of your environment’s dependencies, behaviors, and known failure patterns.
- Automatic root cause inference with contextual logs – Metrics, traces, logs, and topology context are analyzed together in real time to pinpoint the single most likely root cause. Relevant error logs are automatically surfaced in that context — tied to the specific service, time window, and failure mode.
- Remediation specificity – Contextual logs and causal context are routed to an LLM, producing precise and actionable remediation paths.
- Bring your own logs – Whether shipped via OTel or another pipeline, Causely ingests your logs and automatically pulls the right ~0.1% on demand. No pipeline reconfiguration or log warehouse required.
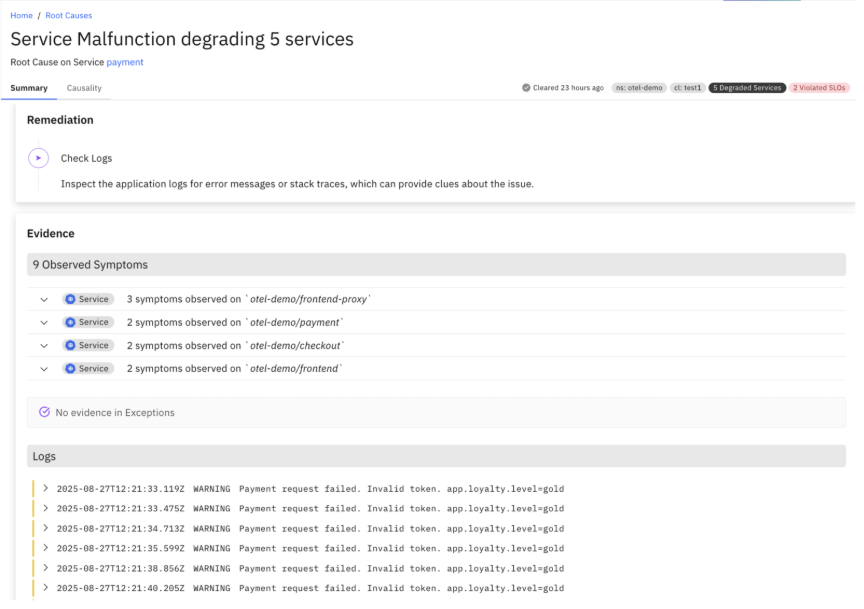
The result: Logs remain first-class citizens. You see them in context of metrics and traces, as proof and evidence of the root cause and remediation path — not a warehouse to sift through, and not a second-class afterthought.
Wrapping Up
The OTel community has done the hard work of making logs consistent, enriched, and correlated with other telemetry. The next step is using them more effectively: elevating logs from raw records to causal signals. That shift makes troubleshooting faster, cheaper, and more reliable.
If you’re following OTel logging best practices, you’ve laid the foundation. With Causely, you can take it to the next level: automatically inferring the root cause in real time, surfacing logs in context, and generating a clear remediation path. All without workflow changes, pipeline reconfiguration, or trade-offs between log richness and operational efficiency.