From Dashboards to Decisions: Introducing the Causely Plugin for Grafana
Endre Sara
May 6, 2025
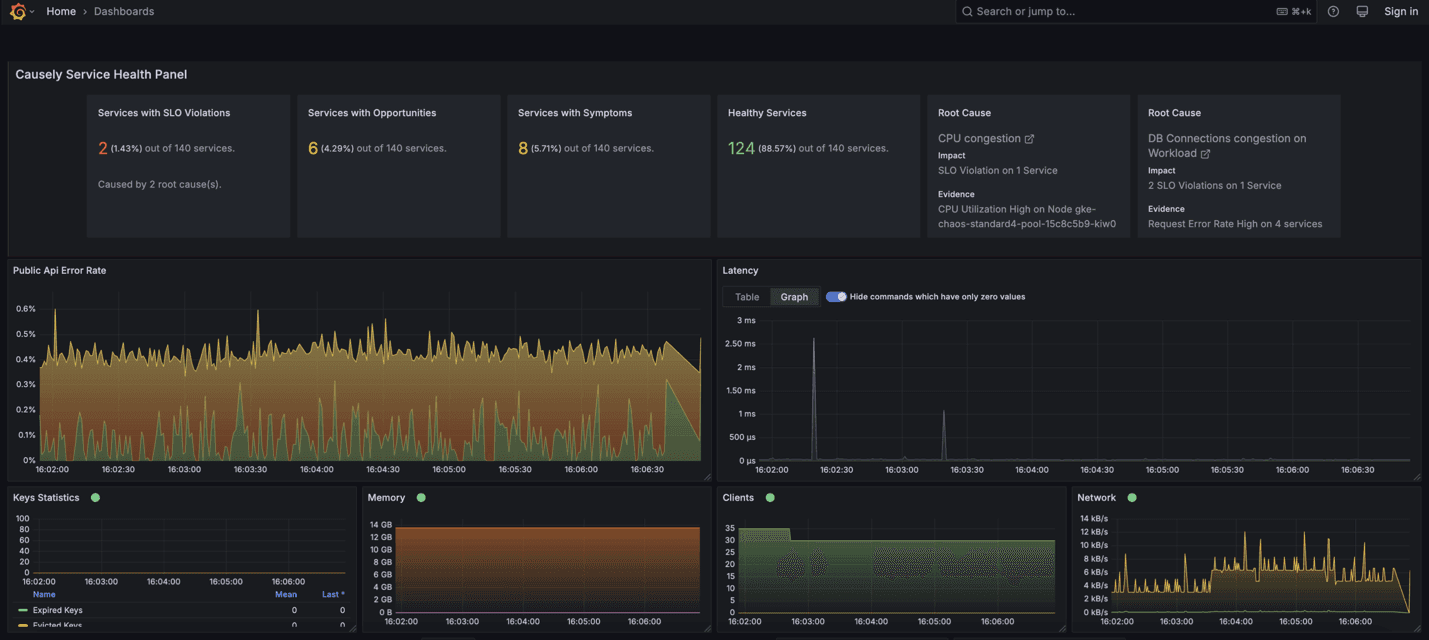
Grafana provides engineering teams with a clear lens into their systems, enabling them to surface logs, metrics, and traces in one unified place. For example, you could create a mission control dashboard, helping teams monitor what’s happening across services.
But even the clearest dashboard doesn’t give you what you need when something breaks.
Observability allows you to see what is happening, but what about understanding why something is happening? With Causely, you can see the why behind what’s happening without having to leave your Grafana interface.
That’s where Causely comes in. Our new plugin embeds root cause intelligence directly into your Grafana dashboards — so you can seamlessly shift from awareness to understanding and from incident response to proactive improvement, all in a single view.
When Observability Stops at What
Modern engineering teams operate in high-stakes, high-complexity environments:
- Dozens (or hundreds) of microservices
- CI/CD pipelines constantly push new code
- SLOs that leave no margin for delay
The result? Even with powerful observability tools like Grafana, most teams still end up in incident management mode: war rooms, escalations, and Slack threads at 2 a.m.
Instead of building, you’re firefighting. Instead of improving systems, you're guessing at symptoms.
Grafana tells you what happened.
Causely shows you why — and what to do next.
Why Grafana + Causely Is Different
This integration was built to help teams detect and truly understand problems—in context and real time.
By embedding Causely’s reasoning engine inside Grafana, teams can now:
- See the root causes for all active anomalies across your environment, not just alerts
- Identify the highest-priority root cause impacting your services right now
- Spot the root causes putting your SLOs at risk — before they’re breached
- Reduce mean time to detect (MTTD) and resolve (MTTR) by surfacing not just data but decisions
Causely continuously analyzes the relationships between services, symptoms, and anomalies — and uses causal reasoning to infer what’s driving those symptoms, all showcased natively in Grafana with the plugin.
Why We Chose Beyla
What’s the superpower behind this integration? It’s what we chose to run under the hood.
Causely connects to your Kubernetes environment using Grafana Beyla, an open-source, eBPF-based instrumentation agent. It gives us deep visibility into your workloads — without sidecars, code changes, or custom configs.
We chose Beyla because it enables our customers scaling on Kubernetes to gain value immediately and understand the root causes of issues impacting their applications. Beyla enables quick time-to-value, minimal friction, and zero disruption to developer workflows.
An important distinction here: Beyla isn’t part of the plugin — Beyla isn’t part of the plugin itself — it’s the component that connects to your environment and continuously monitors your services. The plugin then brings that intelligence into Grafana, making it actionable for your team."
What You Get from Combining Causely and Grafana
Bringing Causely into Grafana means you're gaining critical visibility when you need it most(no longer flying blind!). Together, they create a powerful loop: observability meets root cause analysis - inside your team's workflows.
With Causely + Grafana, you get:
- Instant visibility into root causes for all active anomalies and performance issues across your environment
- The most urgent root cause of degrading your services surfaced right inside your Grafana dashboards
- Proactive identification of issues putting your SLOs at risk - before violations occur
- Context-rich visualizations and alert annotations that go beyond detection to show you what's broken, why it's happening, and the steps to take to resolve the issue
Integrated with Grafana Alertmanager
Causely's root cause alerts can be pushed directly into your existing Alertmanager workflows - so your teams don't just get notified that something's wrong; they get a head start on fixing it. That means fewer escalations, faster triage, and better SLO performance.
Causely's reasoning engine powers all of this. It continuously maps how symptoms propagate through your services and precisely identifies the underlying causes.
As mentioned, this is all enabled in minutes, thanks to Grafana Beyla. This open-source eBPF-based instrumentation layer lets Causely connect to your Kubernetes workloads without code changes, sidecars, or complex configurations. Beyla, let Causely start understanding your environment immediately - so you get value quickly without interrupting your team's flow.
How to Use It
Getting started is straightforward:
- Install the Causely Plugin:
Please find it in the Grafana data source plugin catalog or install it via GitHub.
- Link to Causely:
Connect your Causely deployment to your Grafana instance. No changes to your instrumentation are needed, as Causely uses Beyla to automatically ingest telemetry from your Kubernetes workloads.
- Visualize, Understand, Resolve:
Add the Causely panel to your dashboards. See the root causes, understand the impact, and get ahead of issues before they become escalations.
For complete setup steps, check out the Causely plugin docs.
Start Seeing Root Causes, Not Just Symptoms
The Causely Plugin for Grafana has officially launched and is ready for use. If you rely on Grafana to monitor your services, this is your next step in making observability genuinely actionable.