Why GenAI applications are hard to operate
Endre Sara
May 27, 2026
TL;DR: OpenTelemetry's GenAI semantic conventions have matured to the point where auto-instrumentation is practical. You can now capture LLM calls, tool calls, token usage, and completion content without writing instrumentation code. That gets you the signals, but not an understanding of why they changed. Ensuring the reliability of GenAI applications requires connecting observed signals to their causes across agent workflows.
Why do traditional observability approaches miss GenAI failures?
Traditional observability is not designed for GenAI applications. A latency spike or HTTP 5xx is easy to detect. An agent that starts calling tools in the wrong order, consuming three times the expected tokens, or failing to complete requests under load may generate no metric anomaly at all. Three properties of LLMs make this systematically hard.
Unpredictable inputs. A production LLM endpoint receives free text prompts whose distribution shifts as usage grows. A change in how users phrase requests, or a change in the context an upstream service injects, can alter agent behavior with no code change and no deployment event. Without capturing prompt content as a structured span attribute, there is no way to correlate a behavioral shift to its source.
Unpredictable outputs. The same prompt can produce structurally different responses across calls: different tool selections, different response lengths, different completion rates. These variations affect downstream services that consume the output. Without content captured in the trace, you have a status code and a duration. You do not have visibility into what the agent did.
Silent drift. Agent behavior can degrade gradually with no hard threshold to cross. Token consumption creeps up. Completion rates fall. Tool call patterns shift. None of these fire an alert on their own. By the time the degradation is visible in user-facing metrics, the operational signal has been present for days.
The OpenTelemetry community has been working to close this gap. The GenAI semantic conventions, now in active development, define a standard schema for exactly the signals that traditional observability misses in LLM workloads.
What do OpenTelemetry's GenAI semantic conventions give you?
OpenTelemetry's GenAI semantic conventions define a standard schema for the signals that matter for LLM workloads: spans covering LLM and tool calls, events capturing prompts and completions, and metrics for token usage and latency. The GenAI semantic conventions are now stable enough for production use, and enterprises are leveraging tools like langfuse or Arize Phoenix for their production agents.
The key signals the conventions define:
- Spans for each LLM call, embedding call, and tool call. Each span covers model name, provider, request parameters, and outcome.
- Events (gen_ai.user.message, gen_ai.assistant.message, gen_ai.tool.message) capture the full conversation history when capture_message_content is enabled.
- Metrics: gen_ai.client.token.usage (prompt and completion tokens) and gen_ai.client.operation.duration (latency histogram).
Once this instrumentation is in place, you have a structured, correlated record of every LLM interaction in your system. That record is the prerequisite for evaluations, root cause analysis, cost attribution, and autonomous operations.
Liudmila Molkova’s KubeCon talk on GenAI observability clearly makes the operational point. Classic telemetry signals (latency and errors) are necessary but not sufficient. Understanding what an agent did — which tools it called, in what order, with what inputs and outputs — requires capturing content alongside structure. Latency and status codes tell you that something happened. Spans and events tell you what.
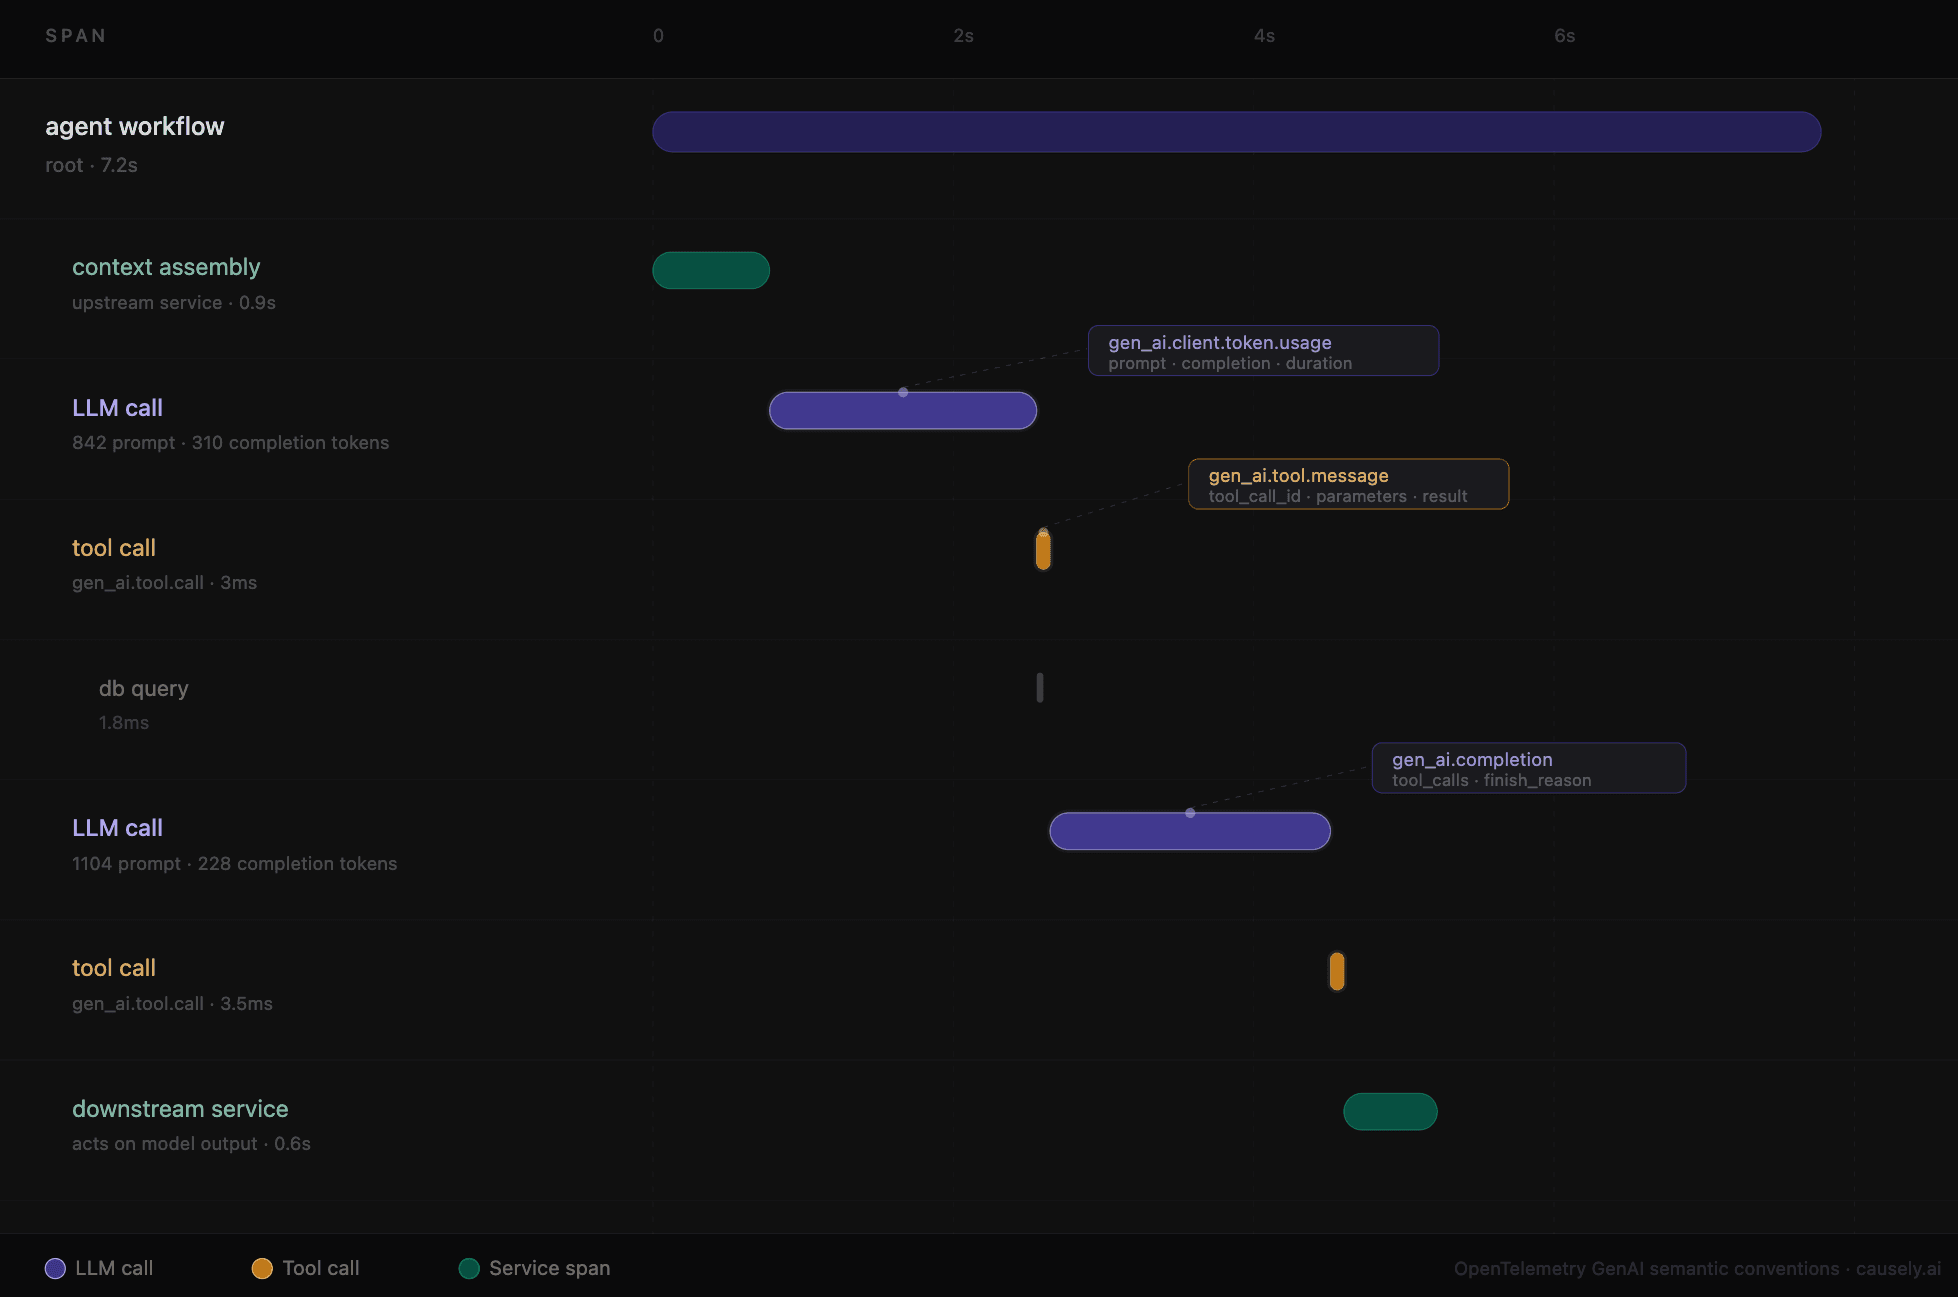
What does OTel GenAI instrumentation give you?
Once OpenTelemetry's GenAI semantic conventions are in place, every LLM interaction in your application becomes a structured, correlated span. You can see what your agent is doing: which model it called, with what parameters, how long it took, how many tokens it consumed, what tool it invoked, and what came back.
GenAI applications do not exist in isolation. LLM calls sit inside a broader service graph. Upstream services that assemble context and inject it into prompts, downstream services that act on model outputs, and infrastructure dependencies that affect latency and availability across the entire chain. Connecting GenAI telemetry to that existing graph, with its service dependencies, deployment history, and causal relationships, is what turns isolated LLM spans into a coherent operational picture.
How Causely Addresses the Gaps in GenAI Application Reliability
Instrumentation gives you signals to know what is changing, but not why. Here are four examples:
1. Latency climbed. Where is the bottleneck? In a multi-hop agent workflow, latency compounds across LLM calls, tool calls, embedding lookups, and the infrastructure serving them. A slow p95 on the agent endpoint could originate anywhere in that chain. Finding it requires understanding the full call graph and how each hop contributed, not just identifying the slowest individual span.
2. Error rates are up. What failed and why? An increase in errors across an agent workflow could mean a tool is failing, a model is rejecting certain inputs, a dependency the agent relies on has degraded, or the agent is looping and exhausting retries. Each has a different fix. Without causal attribution, the investigation starts from scratch every time.
3. Tool calls are failing or slowing down. Why? A spike in tool call errors or latency could mean that an underlying service the tool depends on has degraded, that the tool is being called with parameters it cannot handle, or that a recent change to the tool's interface broke compatibility with how the agent invokes it. The call completes without a timeout or connection failure, but the response indicates a problem (e.g., an error code or an empty result) that propagates silently throughout the rest of the workflow. Attributing the cause requires connecting the tool call signal to the service dependency graph and recent deployment events, not just inspecting the span in isolation.
4. Something that worked at low volume is breaking at scale. Moving from thousands of tasks to millions changes the failure profile. Bottlenecks that were negligible become systemic. Failure modes that were rare become frequent. The causal path from signal to root cause grows longer as the agent graph grows more complex.
Connecting observed signals to their causes across model calls, tool calls, prompt changes, model updates, and the services that surround them is a core problem you can solve by deploying Causely in your environment. If you are working through any of these challenges today, we would love to talk.
FAQ
Why is alerting on latency and error rate for my GenAI agent not enough?
Latency and error rates catch infrastructure failures. They do not catch operational failures specific to GenAI workloads. An agent that starts looping through tool calls, consuming three times the expected tokens, or failing to complete requests under load, can look perfectly healthy in your existing dashboards. The failure is in the behavior of the agent workflow, not in the underlying infrastructure. Capturing it requires visibility into what the agent did — which tools it called, in what order, how many tokens it consumed — not just whether the calls returned a 200.
What's the difference between GenAI observability and classic APM for AI workloads?
GenAI observability builds on top of classic APM. It does not replace it. Latency, error rates, and resource consumption remain essential. The OTel GenAI semantic conventions extend the existing OpenTelemetry schema to add the signals specific to LLM workloads: which model was called, with what parameters, how many tokens were consumed, what tools were invoked, and optionally the prompt and completion content. An SRE still cares about whether the call took 3.2 seconds. A different stakeholder — one responsible for the agent's behavior and outputs — needs the content layer on top of that. The conventions are designed to serve both.
How does token consumption relate to cost and quality?
Token consumption is both a cost signal and a quality signal. A spike in prompt tokens could mean users are sending more context, a template change bloated the system prompt, or an upstream service is injecting data it should not. A spike in completion tokens could mean the model is being more verbose, looping, or hitting edge cases in its instructions. Neither direction is inherently bad, but both warrant investigation when unexpected. Without prompt and completion content captured in the trace, you cannot tell which scenario you are in.
Where do I start if I am running GenAI workloads today?
Start with instrumentation. Enable OTel GenAI semantic conventions for your LLM client calls to get spans, token metrics, and (optionally) prompt and completion content into your observability stack. Once the telemetry is in place, the gaps described above become concrete rather than hypothetical, and the path to causal attribution becomes tractable.
What to do next
If you are building or running GenAI workloads today and want to understand what causal modeling looks like in the context of LLM call chains, talk to our team.