How OpenTelemetry observes AI agents without code changes

Endre Sara
October 13, 2026
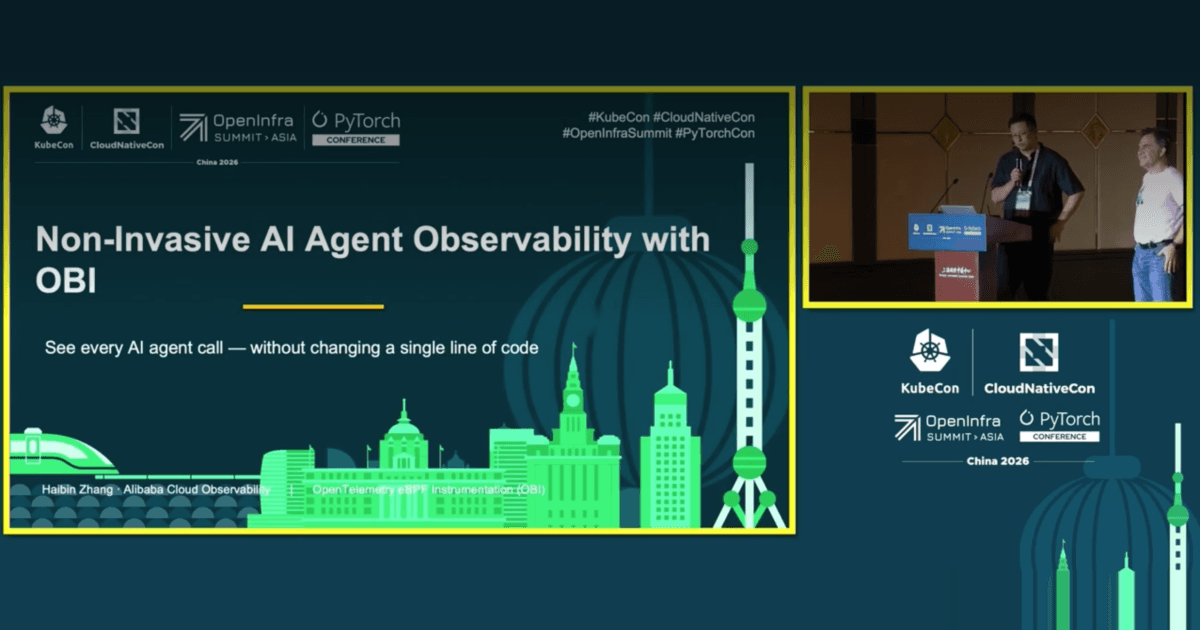
AI agents are hard to operate because instrumentation can't keep up with them. Haibin Zhang of Alibaba Cloud and I made that case at KubeCon China 2026, and showed how OpenTelemetry eBPF Instrumentation (OBI) closes the gap. The full talk is at the end of this post.
Multi-agent applications fail in ways request metrics miss
A traditional request follows a static path: client, gateway, service, database. An agent request is dynamic. One prompt fans out into embeddings, vector search, reranking, tool calls, and other agents, and the path changes on every run.
Haibin shared an example. One customer's token usage on AWS Bedrock and OpenAI grew 320% in a month, and the team could not tell which agent drove it. Other teams call LLM APIs over raw HTTP without a provider SDK, so SDK instrumentation sees nothing.
Library coverage is also fragmented. In Python, Bedrock instrumentation works but Anthropic may not. MCP instrumentation exists for npm but not for Go.
OpenTelemetry now captures agent traffic at the kernel
OBI attaches kprobes and uprobes in the kernel and parses protocols in a separate process outside your application. Because it reads payloads before encryption, it sees LLM and MCP calls over TLS without injecting code. It deploys as a DaemonSet: one process per node, no restarts.
As of OBI v0.9.0, coverage includes OpenAI, Anthropic, Gemini, Bedrock, Qwen, MCP over JSON-RPC, and embedding and rerank providers. When the GenAI semantic conventions change, one OBI upgrade updates every service.
As I said in the talk: "If you cannot observe how many tokens are used, what tools are called, and how many times, it's really hard to figure out how to make your agents better."
OBI complements SDKs. It captures LLM and tool calls from outside the application process, plus what SDKs cannot see: TLS, DNS, and retries. SDKs add in-process detail OBI cannot observe, such as business spans and custom attributes.
Consistent telemetry is a good starting point that still lacks causal context
Consistent telemetry means two things. Every service reports GenAI calls with the same attributes and semantic convention version, and trace context connects those calls across services and languages. In my own production environment, a Go MCP server calls another Go service, which calls a Python service, which calls Gemini or, through OpenRouter, an Anthropic model. One OBI process per node instruments all of it the same way.
Consistent telemetry still leaves a gap. A trace shows an agent called a tool server dozens of times and slowed down. It does not say why. Answering that takes causal context: a model of how the agent, its tool servers, model providers, and the infrastructure beneath them can fail, and which symptoms each failure produces.
That is the layer we build at Causely. It uses OBI alongside the metrics, logs, traces, and infrastructure data teams already collect, and adds a causal model that checks observed symptoms against known cause signatures, including AI model-specific causes, and returns a diagnosis.
This builds on why GenAI applications are hard to operate and our earlier work instrumenting Java with OBI.
What to do next
Watch the full talk below, then deploy OBI as a DaemonSet on a cluster running your agents. The project is active and welcomes contributors: join the SIG calls or pick up an open issue in the OBI repository.