How to Operate AI Agents in Production: The Three-Layer Stack

Yotam Yemini
August 20, 2026
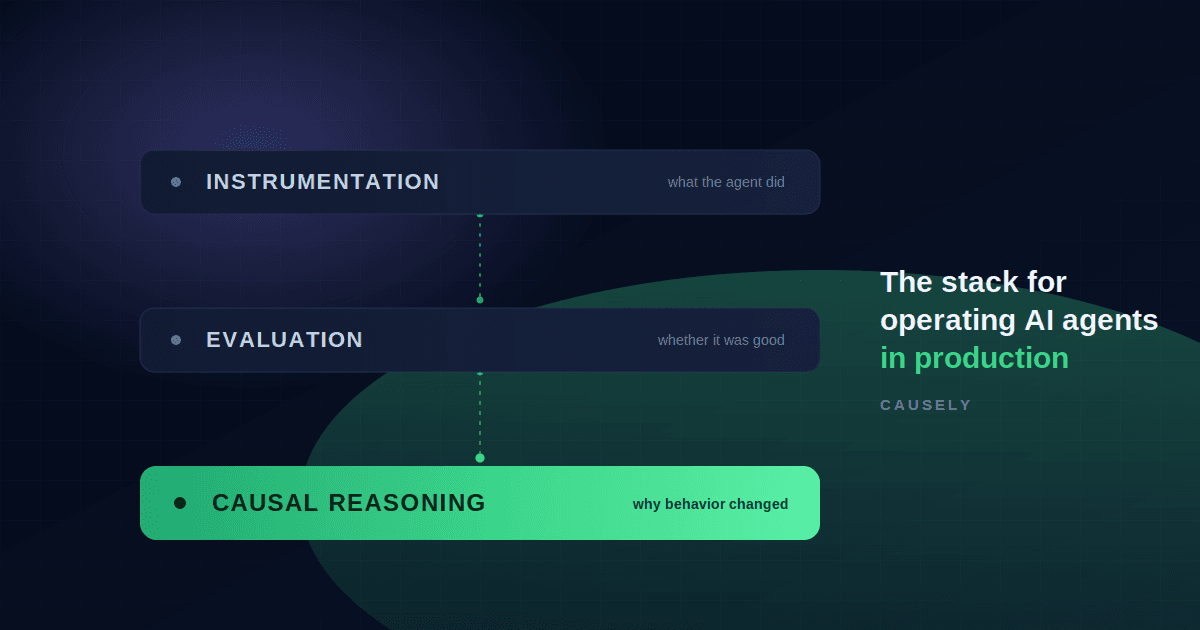
TL;DR: Running agents in production is a layered discipline. Instrumentation captures what the agent did. Eval and observability platforms like Comet, Langfuse, Braintrust, Galileo, and Arize measure whether the output was good. A causal reasoning system explains why behavior changed across the services and infrastructure the agent runs on. Each layer has a distinct job. Together they are what it takes to operate agents in production with confidence.
Operating Agents Is Becoming a Layered Discipline
You shipped an agent to production. When its output quality slips, or latency climbs, or it starts failing tasks it used to complete, the first question is always the same: why. Answering it has become its own discipline, and teams running agents at scale are assembling a proper operational stack to do it, the same way teams running microservices did a decade ago.
Here is how that stack is taking shape, and where a causal reasoning system fits into it.
Layer One: Instrumentation
Everything starts with capturing what the agent actually did. OpenTelemetry's GenAI semantic conventions give you a common vocabulary for LLM calls, tool calls, token usage, and, increasingly, whole agent and MCP call trees as first-class spans. The conventions are still under active development as of mid-2026, so attribute names can shift and you should budget for the occasional rename. But they have consolidated enough to standardize on, and real backends already emit and ingest them. Instrumenting against them gives you a structured, correlated record of every interaction, the foundation the other layers build on.
Layer Two: Evaluation and Agent Observability
Once you have the signals, you need to know whether the agent is doing a good job. This is where the eval and LLM observability platforms live: Comet, Langfuse, Braintrust, Galileo (now part of Cisco), Arize (now part of Dynatrace), and others. They each have a different emphasis. Some lean toward the offline eval and experimentation loop, others toward production monitoring and tracing, but they share a purpose: scoring outputs, catching regressions, and tracking agent behavior against datasets and guardrails.
Output quality is only part of the story. This layer is also about understanding the agent's operational health: latency and error rates, along with agent-specific signals like repeated or redundant tool calls, cache efficiency, and token consumption, much of which falls out of the same OTel instrumentation from Layer One.
If you are operating agents in production, you should be using one of these, or a comparable solution. They answer two important questions: what did the agent do, and is it doing its job well? Every team needs to be able to answer those questions.
Layer Three: Reasoning Across the Stack
The first two layers answer what and whether. The third answers why, and it is the hardest of the three.
An agent in production sits on top of everything else you run. The LLM call is one hop in a chain that includes the services assembling context, the vector stores and databases serving retrieval, the APIs exposed as tools, the queues moving work between steps, and the compute, network, and storage underneath all of it. When output quality drops or latency climbs, the origin is often somewhere in that chain rather than in the agent itself:
- A tool starts returning empty results because a backing service degraded, and the agent compensates by retrying or looping around the gap.
- Retrieval quality slips because an embedding pipeline stalled and the index went stale, so answers get quietly worse while traces look normal.
- p95 latency doubles because a database serving context assembly is under memory pressure, not because the model slowed down.
- A routine deployment to a shared dependency changes a default timeout, and the agent starts hitting intermittent tool failures it never saw before, with nothing in the agent itself having changed.
Connecting a change in agent behavior to its origin somewhere below the agent is a distinct problem, and it is genuinely hard, because it means reasoning across the causal relationships between the agent and every layer of the stack it depends on. This is not a new goal. Cross-layer causal analysis has been the direction of travel in observability for years. What is still open is how you actually do it in software, rather than leaning on the tribal knowledge of a few senior engineers and an ever-growing pile of runbooks.
What Is the Best Approach for Managing AI Agents in Production?
The industry consensus is clear, and the recent moves make it clearer. Cisco acquiring Galileo and Dynatrace acquiring Arize, at a reported $915M, are both bets on bringing agent telemetry and infrastructure observability under one roof. Datadog has been building toward the same goal organically. The Dynatrace announcement said the premise plainly: when an AI application's output quality slips, the cause can sit anywhere from the prompt to the model to the infrastructure underneath it. We agree that reasoning across the layers of the stack is the right goal, and it is the premise we started Causely on years ago.
Where approaches diverge is on how you go from observable symptoms to the specific issue that needs to be addressed. The dominant path has been correlation and machine learning over telemetry, and the recent acquisitions extend it by putting more of that telemetry, agent and infrastructure, in the same place. That is a step forward, and co-located data makes correlation easier. But it also has a ceiling: correlation tells you an eval score dropped around the time a database schema changed, which sometimes points at the real issue and sometimes at a coincidence.
In an environment with many components changing constantly, separating signal from noise takes a model of how system behaviors propagate across layers: which services feed context into which prompts, which tools depend on which backends, how a degradation in one place surfaces as a symptom somewhere else.
That model-based approach is the bet Causely makes. Instead of correlating signals after the fact, the system maintains a live causal model of the environment and reasons over it deterministically. Because the reasoning follows the model rather than pattern-matching over history, it does not surface hallucinated root causes, and it points at the specific issue to fix rather than a ranked list of correlated suspects. Across production deployments, customers have seen 63% faster incident resolution and 57% lower operating cost, with zero hallucinated root causes.
How Does Causely Pinpoint the Cause of Agent Degradations?
We made a decision from day one to build a system that ingests data from any combination of sources, whether that includes OpenTelemetry, your existing observability platforms, or GenAI instrumentation, and produces a semantically consistent representation of your environment. From it, our system instantiates thousands to tens of thousands of causal models that encode how an issue in one part of your stack causes symptoms in others. All of this causal knowledge is continuously maintained as the environment changes.
There are two primary patterns for how customers are putting this knowledge to use, which help illustrate how it fits alongside the rest of your stack:
- On Demand. An alert fires, Causely answers why. Route existing alerts into Causely, or let your agent query Causely's MCP server as part of an investigation. One call returns signal vs. noise, causal analysis, blast radius, and supporting evidence.
- Proactive. Causely surfaces emerging system degradation with causal analysis attached and triggers a background agent to act. The same payload can be sent to any destination you choose before an SLO is violated or an incident is declared.
One customer described the proactive pattern in concrete terms. Causely detected emerging degradations and pushed the causal diagnosis to their background agents, which resulted in twelve agent-initiated pull requests that the team merged after human review. By their account, each change saved their five-person team two to three hours over the month, and that is before counting the incidents they prevented. They framed this benefit as the equivalent of adding a full-time engineer dedicated to keeping performance healthy and preventing incidents.
The eval layer keeps doing what it does best: output quality, regression testing, guardrails, the development loop. Causely sits underneath and across it, connecting what the agent did to why the surrounding system shaped that behavior. If you are building agents and automated workflows on top of this data, we have a lot to talk about.
The Whole Stack, Working Together
No single layer is the whole answer, and none of them replaces the others. Instrumentation tells you what the agent did. Evaluation tells you whether the output was good. Causal reasoning tells you why the behavior changed, across the services and infrastructure the agent runs on. The teams operating agents with the most confidence are the ones running all three.
If you want to see for yourself, try it free. Or reach me directly via email (yyemini@causely.ai) or on LinkedIn.
FAQ
Does Causely replace my eval platform? No. Eval platforms own output quality: scoring, datasets, regression testing, guardrails. Causely pinpoints the cause of a degradation by reasoning across the agent layer together with the various services and infrastructure components the agent depends on. They are complementary.
I use Arize or Galileo, what do the acquisitions mean for me? Those products now live inside larger observability portfolios. What the acquisitions signal is that agent and infrastructure telemetry are converging. Causely is interoperable with all of these products and will stay that way. We already consume data from Dynatrace, Datadog, OpenTelemetry, and others, and reason across all of it.
How does Causely know about my agent workflows? Causely builds a topology of your environment from the data sources you already have, including OTel GenAI instrumentation where present. Your agent workflows appear in the causal model alongside the services, data stores, and infrastructure they depend on, so an issue anywhere in the stack can be mapped directly back to the workflows it affects.
What does "proactive" mean here concretely? The system does not wait for you to query it. The causal model is evaluated continuously as telemetry flows in, so emerging degradations are identified and attributed to their cause as they develop. Causely can trigger a background agent, send a message, or initiate a remediation workflow, often before the issue rises to the level of an incident.