

How to make Claude background agent 3-5x faster and cheaper

Ben Yemini
September 23, 2026
TL;DR
We ran two Claude Managed Agents against injected regressions in a 36-microservice Go app on Kubernetes. Both got the same page, same cluster, Grafana access, and the same source code. One also had Causely's MCP server. Both agents produced a correct fix every time. The agent with causal context used 3.6x to 7x fewer tool calls, finished 3.6x to 5.7x faster, and cost 3.5x to 5x less.
In my previous posts on Claude Managed Agents I discussed how to give an agent access to production and what should trigger it. If you have not already read those, here is the most relevant part to get you caught up. Anthropic's AI-Native SDLC Playbook, published this August, provides best practices for applying AI across six stages. The six-stage framework used in the playbook should be familiar to anyone who has been working in enterprise software. Stage six, maintain, is where background agents serve a critical role. In this post, we measure the effectiveness of the agent running at this step and the impact of providing the agent with causal context.
Testing for one key difference
To understand the impact of causal context, we set up two identical Claude Managed Agents building on the framework and repo examples shared by Anthropic. Both agents can query what is running in a Kubernetes cluster via the k8s MCP. Both have access to Grafana MCP, including application metrics, traces, and logs. And both have access to the application source code on a GitHub branch, where the regression is introduced; more on that below. One also has access to Causely and the causal context it provides, based on the same traces, metrics, and logs that flow into Grafana.
We ran both agents through three different fault scenarios. And prompted them with the same starting point (e.g., service x is degrading). In each case, the service we named is two to three hops from where the actual fault is introduced. This is used to mimic what we often see in larger environments, where an on-call engineer manually declares an incident but cannot identify the exact service at fault at the start of the investigation. Or in environments where alerts automatically trigger the start of the investigation; however, the triggering alert is just for one of the multiple services whose threshold is out of band.
| Fault | Service named in prompt | Hops |
|---|---|---|
| billing service timeout | api-gateway | 2: api-gateway → checkout → billing |
| recommendation service memory limits | search | 2: search → ranking → recommendation |
| pricing service excessive calls | frontend | 3: frontend → api-gateway → cart → pricing |
For each scenario we measure the correctness of the fix by reviewing the PR the agent proposes, the tool calls, the time it takes and the cost.
The one other difference is that the agent with access to Causely is instructed to first call get_issues scoped to the namespace where the app is running. This is similar to triggering the agent with an Issue, which is what we previously argued is much more effective than triggering it with an out-of-band threshold violation.
Typical regressions as faults
To make these scenarios more real-world, we introduced code-based regressions in either the application or the infrastructure configuration, rather than relying on fault-injection methodologies. The application itself is an e-commerce app composed of 36 microservices written in Go, running in a single Kubernetes namespace, with Kafka, Redis, and Postgres for persistence. A frontend and a fan-out to multiple services, with a load generator running continuously to mimic eight different user flows. The repo, including app source code and scenario setup, is available here.
Here are the three regression fault scenarios:
1. Billing Service Timeout
The billing service's HTTP outbound client has been refactored to improve the use of existing connections. The refactor accidentally removes the connection request timeout. Now, when the payment-adapter service is slow, requests from the billing service hang instead of failing fast, and checkout latency starts to climb.
2. Recommendation Service Memory Limits
An inadvertent change to a YAML file set the request memory to 8 Mi and the limits to 10 Mi, for a service that typically runs at ~10 to 13 Mi. The pods start experiencing OOMKilled restarts; multiple services (e.g., search, ranking) experience elevated error rates, and search latency climbs as ranking waits on search.
3. Pricing Service Excessive Calls
A change to the pricing service code now calls the discount service once per line item in the cart, rather than once per cart. Both the discount and cart service experiences increase latency as cart size grows, and frontend latency increases for users trying to complete a transaction.
Each of these regressions is introduced in a branch that includes additional unrelated changes, so a simple revert of the latest code changes is not an effective remediation.
Searching vs. starting with a diagnosis
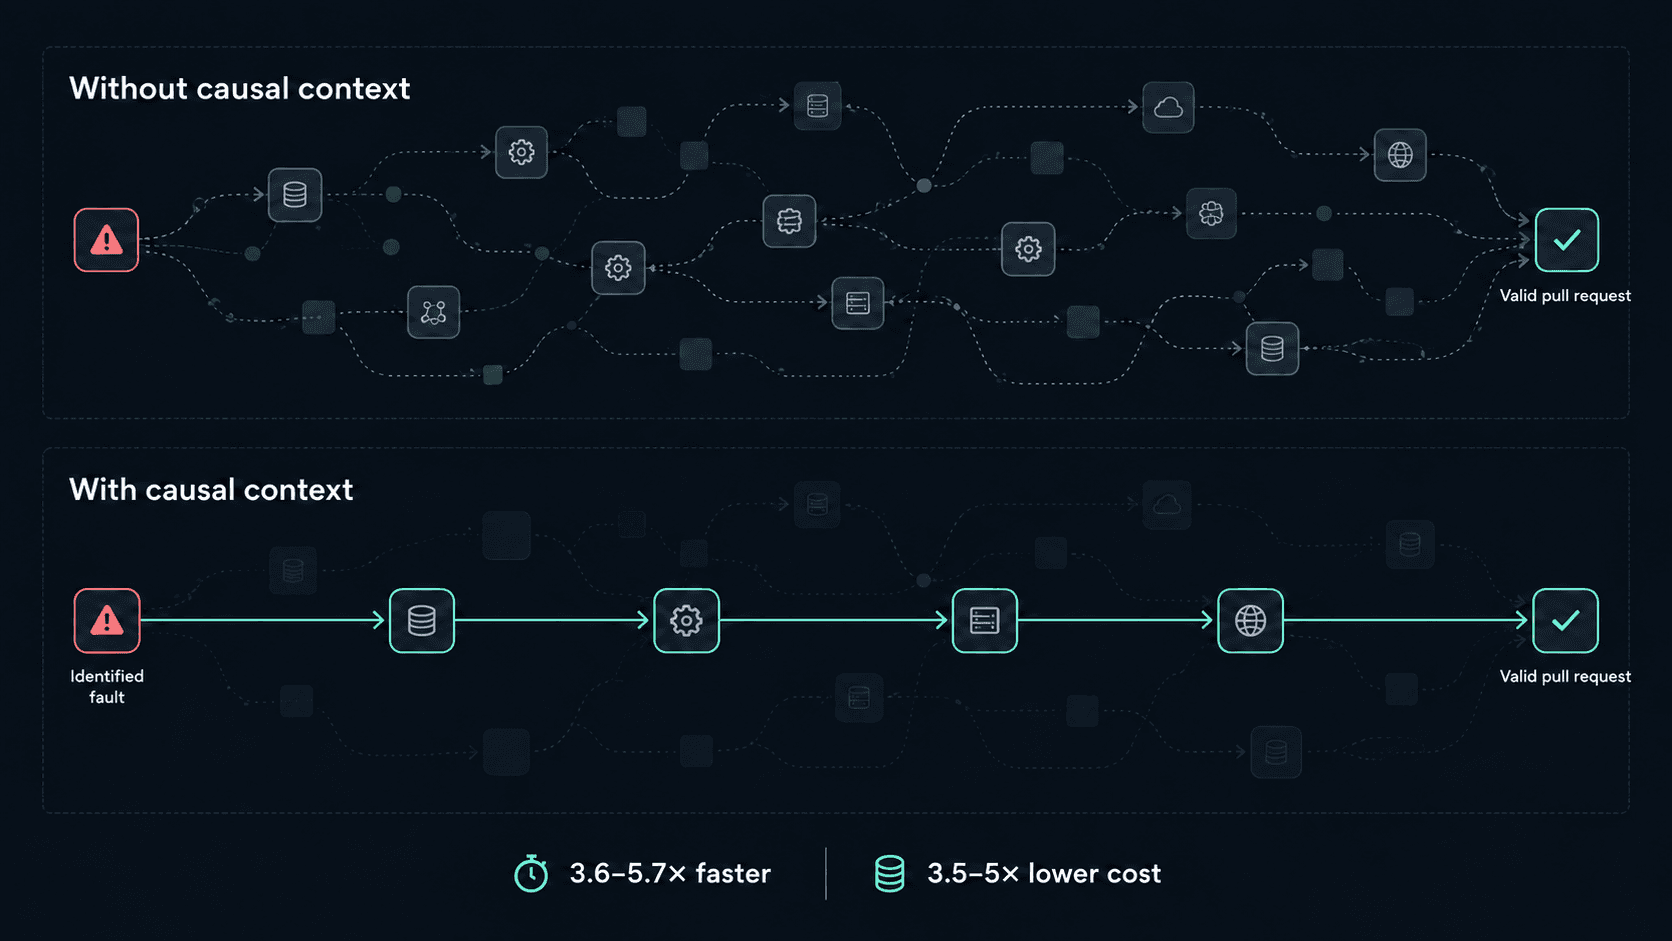
With causal context, the agent takes a different approach. Instead of rediscovering the system from scratch each time, it starts from an answer and focuses on confirming its validity and fixing the underlying code regression. This can be seen by reviewing the session traces. The Claude Managed Agents platform comes with this visibility. You can see every call the agent makes, how long each takes, where they encounter errors, and how many input or output tokens they consume.
Reviewing the Baseline agent – the one without causal context – we can see the following pattern. The agent first orients on the environment by listing pods in the namespace, checking for recent k8s events, and pulling logs for the named service. It then goes deep into the codebase to understand the layout and reconstruct the service dependency graph. It now starts a broad trial-and-error telemetry query for each service in the dependency chain, using dozens of PromQL queries. It is essentially making educated guesses about which services and signals matter and pursuing those guesses. At the same time, it has a side-quest running checking for firing alerts, autoscaling config, and additional infrastructure signals. Once it has the suspected service, it focuses on git logs to understand recent commits and develop a hypothesis for what the exact app or infra code change needs to be. Finally, it confirms that current live metrics support this hypothesis, applies the edits, commits, and pushes.
On the other hand, the agent with causal context starts by asking, “What is wrong?” The first call is almost always get_issues. This returns the implicated entity. The agent now investigates this lead to corroborate Causely’s diagnosis with raw evidence. It then focuses on the specific file(s) associated with the flagged entity rather than reviewing the entire repo and reconstructing the dependency graph. From there, it follows a similar pattern: reviewing the git history for this part of the codebase, then following the same closing sequence as the baseline agent – fix, commit, and push.
Both agents were correct, but one did 5x the work
In all the scenarios we tested, both agents identified the correct underlying cause and raised a PR with a valid fix. Neither blamed the service named in the initial prompt (e.g., search in fault scenario 2). The difference was speed and cost. The agent without causal context was slower, made many more tool calls, and used more tokens.
| Fault scenario | Tool calls | Time | Cost | |||
|---|---|---|---|---|---|---|
| Baseline | With Causely | Baseline | With Causely | Baseline | With Causely | |
| One | 155 | 21 | 18m 1s | 3m 10s | $14.34 | $3.17 |
| Two | 125 | 18 | 12m 18s | 2m 28s | $10.77 | $2.17 |
| Three | 105 | 29 | 10m 31s | 2m 57s | $11.92 | $3.39 |
The table shows one run per scenario. Managed Agent sessions vary from run to run in tool calls, time, and overall cost. The size of the gap is more informative than the exact values. A 5x difference in cost (fault scenario two) or a 7x difference in tool calls (fault scenario one) will not close to 1x with additional runs.
Without causal context, the agent rebuilds the system picture on every run, making many more tool calls and burning tokens to reconstruct what Causely already exposes as its semantics.
Ready to try this with your agent?
We’ve made the scenarios and evaluation harness available in our Causely open-source repos. The setup for the agents and evaluation approach can be found in the background agents repo under Claude Managed Agents, and the application, including code regression faults, can be found under the Regression Lab repo.
