Expanded Dynatrace Support: Better, Faster, Cheaper Agents

Ben Yemini
July 24, 2026
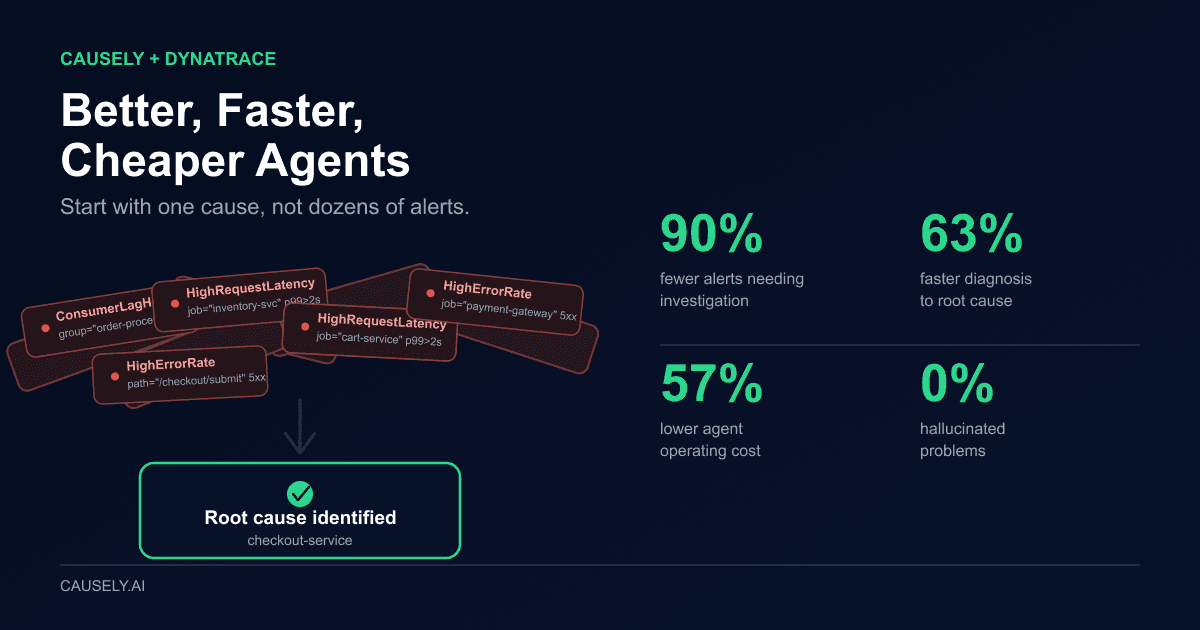
90% alert noise reduction, 63% faster, 57% lower cost, no hallucination.
TL;DR: Causely ingests the rich telemetry Dynatrace provides and uses it to construct an environment-specific causal model. When alerts fire, Causely pinpoints the cause that explains them, even when the originating entity itself never fired an alert. One diagnosed cause, instead of dozens of alerts, is what makes agents better, faster, and cheaper. Validated at a Fortune 50 enterprise across EKS, ECS, and VMware.
The gap that even the best instrumentation leaves
Dynatrace does a great job instrumenting hybrid environments: Kubernetes and serverless workloads, public cloud, and on-prem, all under one platform instead of five different tools stitched together. That breadth is exactly why, when a service fails or becomes congested, Dynatrace can see the whole blast pattern: dozens of alerts fire across multiple services when real problems arise. As a result, dozens of symptoms across connected services generate an alert storm and it becomes very difficult to differentiate between cause and effect.
This is what we commonly see across production environments running hundreds to thousands of microservices. Rich telemetry from sources like Dynatrace tells you what is happening, but leave a gap in terms of understanding why it is happening (i.e., the diagnosis best matching the observed and unobserved symptoms). That gap typically gets closed by on-call engineers and incident channels operating under time pressure. Increasingly, teams are bringing AI agents into the loop (more on that topic here).
Tens of alerts, one triage tax
Dynatrace's tracing shows you the call path: a payment service calls a queue, which calls a downstream cache. What it doesn't understand is causation: which failure on that path produced the anomalies showing up everywhere else. A payment service timing out, a queue backing up, and a cache miss all fire as separate alerts because of their dependencies. The on-call engineer's job becomes manual correlation. Open ten tabs. Cross-reference deploy timelines. Guess at the chain. Page the wrong team at least once before landing on the cause.
That triage tax doesn't appear as a metric, but it's why MTTR climbs every time the service graph gets one layer deeper. Usually, it isn't a single path with a single point of failure. It's multiple paths at once, and the alert explosion engineers have to chase grows dramatically, driving the triage tax even higher.
How Causely improves Dynatrace
Dynatrace provides rich instrumentation for the first three layers in Causely's six-layer semantic model. Causely uses that data to do three things:
- Extract the inventory of entities to instantiate the entity model,
- Map the relationships between them to build the topology model, and
- Use alerts generated in Dynatrace - their way of flagging that a symptom is present - as inputs to the behavior model.
Dynatrace stops at layer three. The layers above it, starting with causality, are what Causely brings to any environment (with or without Dynatrace). Causely maintains - in advance - an encoded set of potential causes and the symptoms each one produces, kept current as the environment changes. When ten alerts fire, Causely treats them as observed evidence, checks that evidence against the encoded causes, and identifies which encoded cause explains them. The output isn't a promoted alert. It's a diagnosis.
What a Fortune 50 Dynatrace customer achieved
In a recent engagement with a Fortune 50 enterprise, the validated result of adding Causely to the environment was a reduction in alert noise of more than 90%.
A flood of Dynatrace alerts describing symptoms were consolidated into a single notification containing the actual cause explaining the observed symptoms. The cause and its blast radius were available in seconds and a triage call was avoided. For an engineering leader building the case to their CTO, there is no stronger proof that Causely reduces on-call load and MTTR.
Better, faster, cheaper agents
While noise reduction is a strong benefit, it’s just the starting point. A verified cause provides an even more important foundation for the on-call agents.
Better. An agent grounded in a diagnosed cause acts on the right service. An agent reasoning over ten raw alerts or investigating different fault tree analysis paths is guessing, and a wrong guess in production doesn't just fail; it can make the incident worse. In a 72-experiment benchmark, agents grounded in a causal model detected faults with zero false positives: no hallucinated causes to chase down
Faster. The diagnosis is available the moment alerts fire, because the causal model was built before the incident, not reconstructed during it. The agent skips the investigation phase entirely and starts at the remediation step. 63% faster in that same benchmark.
Cheaper. Feeding an agent ten of alerts, the logs behind them, and the topology around them, and asking it to reconstruct the causal knowledge for each of them every time the alerts are fired burns tokens on every query while the agent re-derives what a causal model already knows. Feeding it one diagnosed cause with its blast radius is a fraction of the context and none of the wasted remediation cycles. 57% lower operating cost across the same study.
Dynatrace's own 2026 release direction points toward autonomous prevention, remediation, and optimization at scale. The whole industry is moving toward letting agents act on findings rather than just surface them. Causal grounding must come before agentic action, not alongside it.
See the hard data behind the numbers.
Who sees the data, and who acts on it
Grounding AI agents isn't only about whether the reasoning is correct. For enterprises in regulated industries, it's also about who sees the data and which model gets to act on it. Causely runs in the customer's environment, connects to Dynatrace wherever it's deployed, and processes data locally. The causal model and the LLM stay separate layers: the causal model runs in the customer's environment, and the customer controls which LLM is used to ingest the causal output. Remediating an issue never requires sending topology or log data to an LLM the customer didn't choose.
Expanded Dynatrace support
With our latest release, Causely now ingests how data flows between application components and underlying infrastructure directly from Dynatrace instrumentation, including public cloud and on-prem environments such as VMware. Your existing Dynatrace infrastructure alerts now automatically inform the model, mapping to infrastructure symptoms Causely already tracks, alongside the application-layer alerts already mapped.
This makes it easier to put Causely's semantics and causal model on top of your Dynatrace instrumentation wherever your applications run, so you reach the cause of alerts faster and dramatically reduce alert noise and MTTR. There's no separate integration project: adding a Dynatrace target is the only step needed. From there, you can connect that semantics to an AI agent for autonomous remediation, either through the Causely remote MCP server with your agent of choice, or, for more control over the data, running the whole thing in your environment.
FAQ
What does "cause in seconds" actually mean? It means the causal model has already encoded the potential causes in your environment and the symptoms each one produces, before the incident happens. Each potential cause is encoded as a unique signature of symptoms it may cause. When alerts fire, they're evidence checked against the pre-computed signatures, not the start of a live investigation. The diagnosis is inference against a known model, which is why it takes seconds.
Does this replace Dynatrace, or sit alongside it? It sits on top of an existing Dynatrace deployment. Causely doesn't re-instrument the environment. It ingests the entities, topology, and alerts that Dynatrace already emits and adds the causal layer, cause and effect, that turns them into a diagnosis.
Isn't Dynatrace's telemetry already enough on its own? The telemetry is the foundation, and it's genuinely rich, covering Kubernetes, serverless, cloud, and on-prem. What it doesn't include is causality, the model that says which problems produce which symptoms. Causely builds that layer on top of what Dynatrace already collects.
Does this work outside Kubernetes, or only for container platforms? Yes. The expanded integration covers EKS, ECS, and VMware, so the pattern holds whether the topology is Kubernetes-based, ECS-based, or VMware-based in your own data center.
Do I need to change my Dynatrace setup to use this? No. Adding a target through the Causely integration page is the only step. No separate instrumentation or migration project is required.
What to do next
Connect a Dynatrace target if you're already running on EKS, ECS, or VMware and want to see the diagnosis against your own topology. Get started here.